Filing-anchored structural research
Research on capital structure, debt, dilution, financing, refinancing, credit and payout mechanics. Reported facts, DFB calculations and unresolved questions are kept distinct, with the source, period and limitations visible.
Five questions in the disclosed record
The method follows the issuer, the transaction and the funding terms. It applies to growth companies as well as REITs, BDCs and other income structures.
Capital structure and dilution
Debt, equity, conversion terms and share-count changes read on their stated basis. Repurchase authorization, forward settlement capacity and shares actually issued remain separate.
Debt maturity reconstruction
Year-by-year schedules rebuilt by debt type from supplemental packages, then summed and tied to the issuer’s stated total before any reading is drawn from them.
Financing events
Issuance, retirement, term-loan draws, swap terms, forward equity and settlement obligations, taken from 8-K filings and supplementals rather than from summaries.
Covenant and threshold distance
Reported distance to contractual thresholds, carried with the issuer’s own caveat on how those ratios should be read. Distance is not translated into borrowing capacity.
Cash flow and payout mechanics
Issuer-defined earnings measures, cash generation and distributions are read with their periods and adjustments stated. Differences in definitions remain visible in any comparison.
Reported facts, calculations and open questions
Amounts and terms stay attached to the entity, reporting date and original disclosure. A maturity date and completed repayment are recorded separately.
Calculations show their inputs, units and scope. A stated coupon comparison is not presented as an all-in financing cost or a forecast of earnings.
A missing confirmation remains an evidence gap, not an allegation. The record identifies what was reviewed and which later evidence could change the status.
Every schedule must tie back to the issuer total before a gap is called “not disclosed.”
Operating ruleThe working papers are published
These pages reproduce the published MAA / W. P. Carey Technical Appendix. They show the calculations and reconciliation format in an existing REIT working paper.
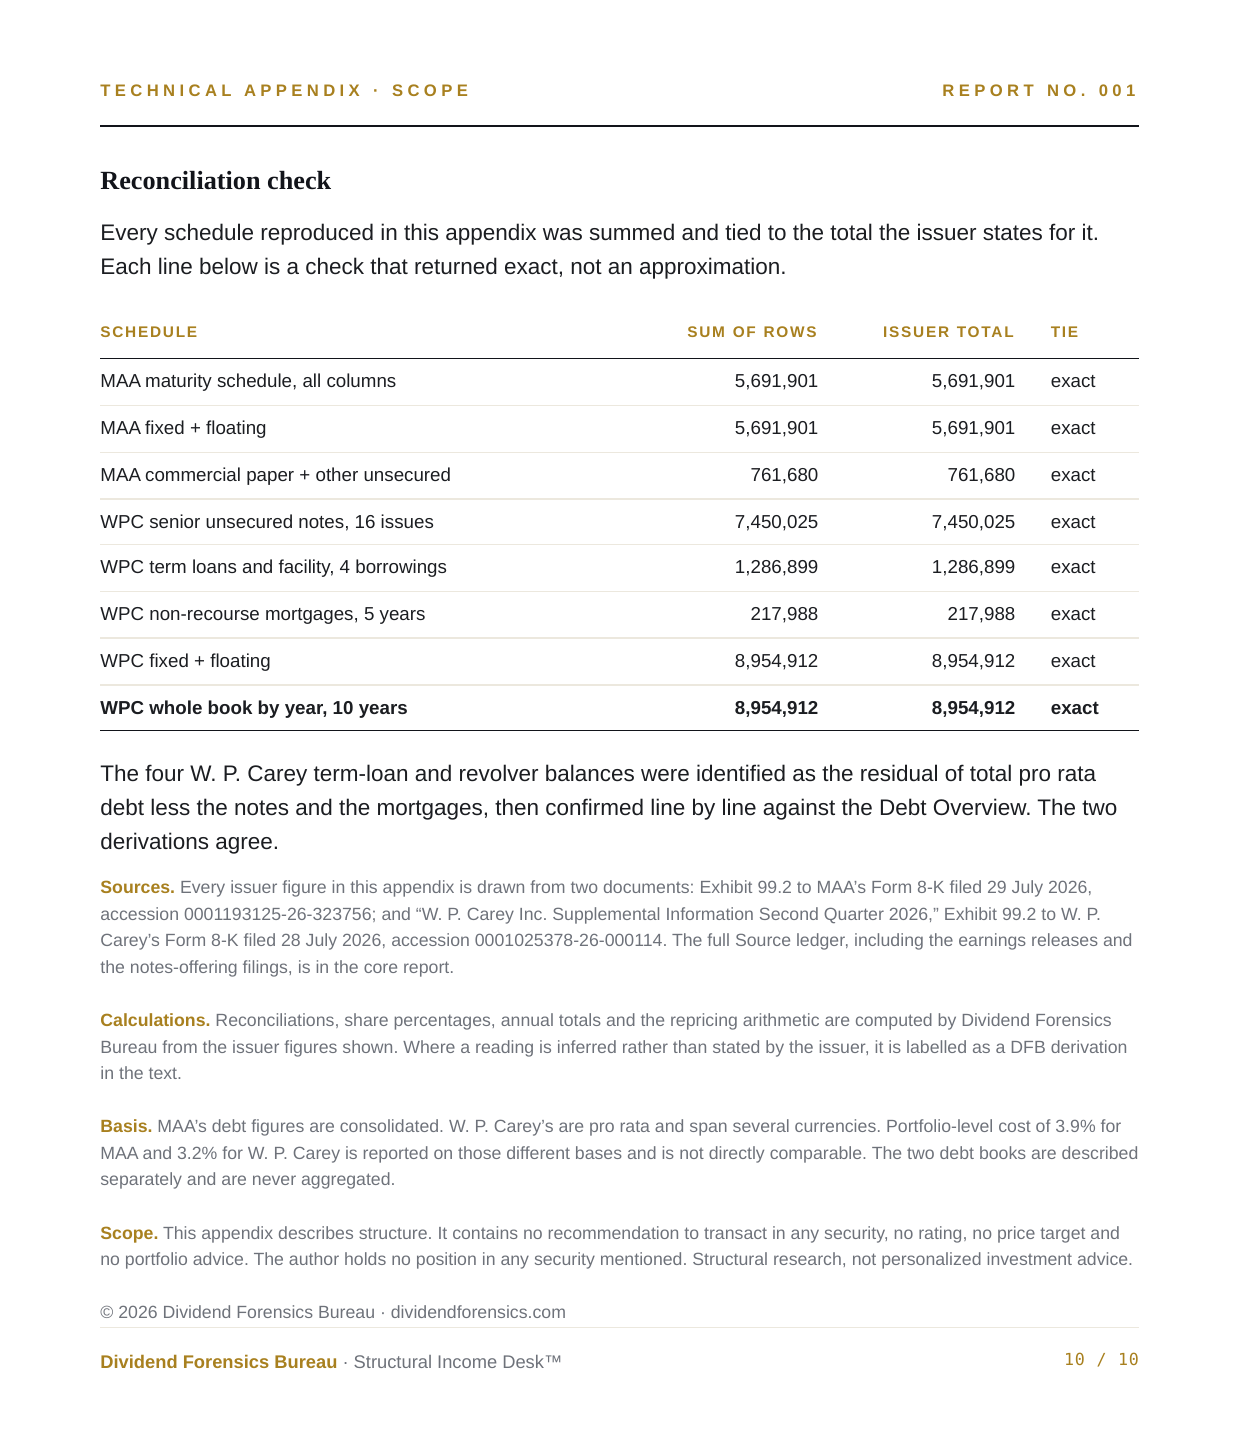
Eight reconstructed schedules. Eight exact ties to issuer-reported totals. Where a balance was identified by residual rather than stated by the issuer, the derivation is labeled and the two methods are shown to agree.
Sources —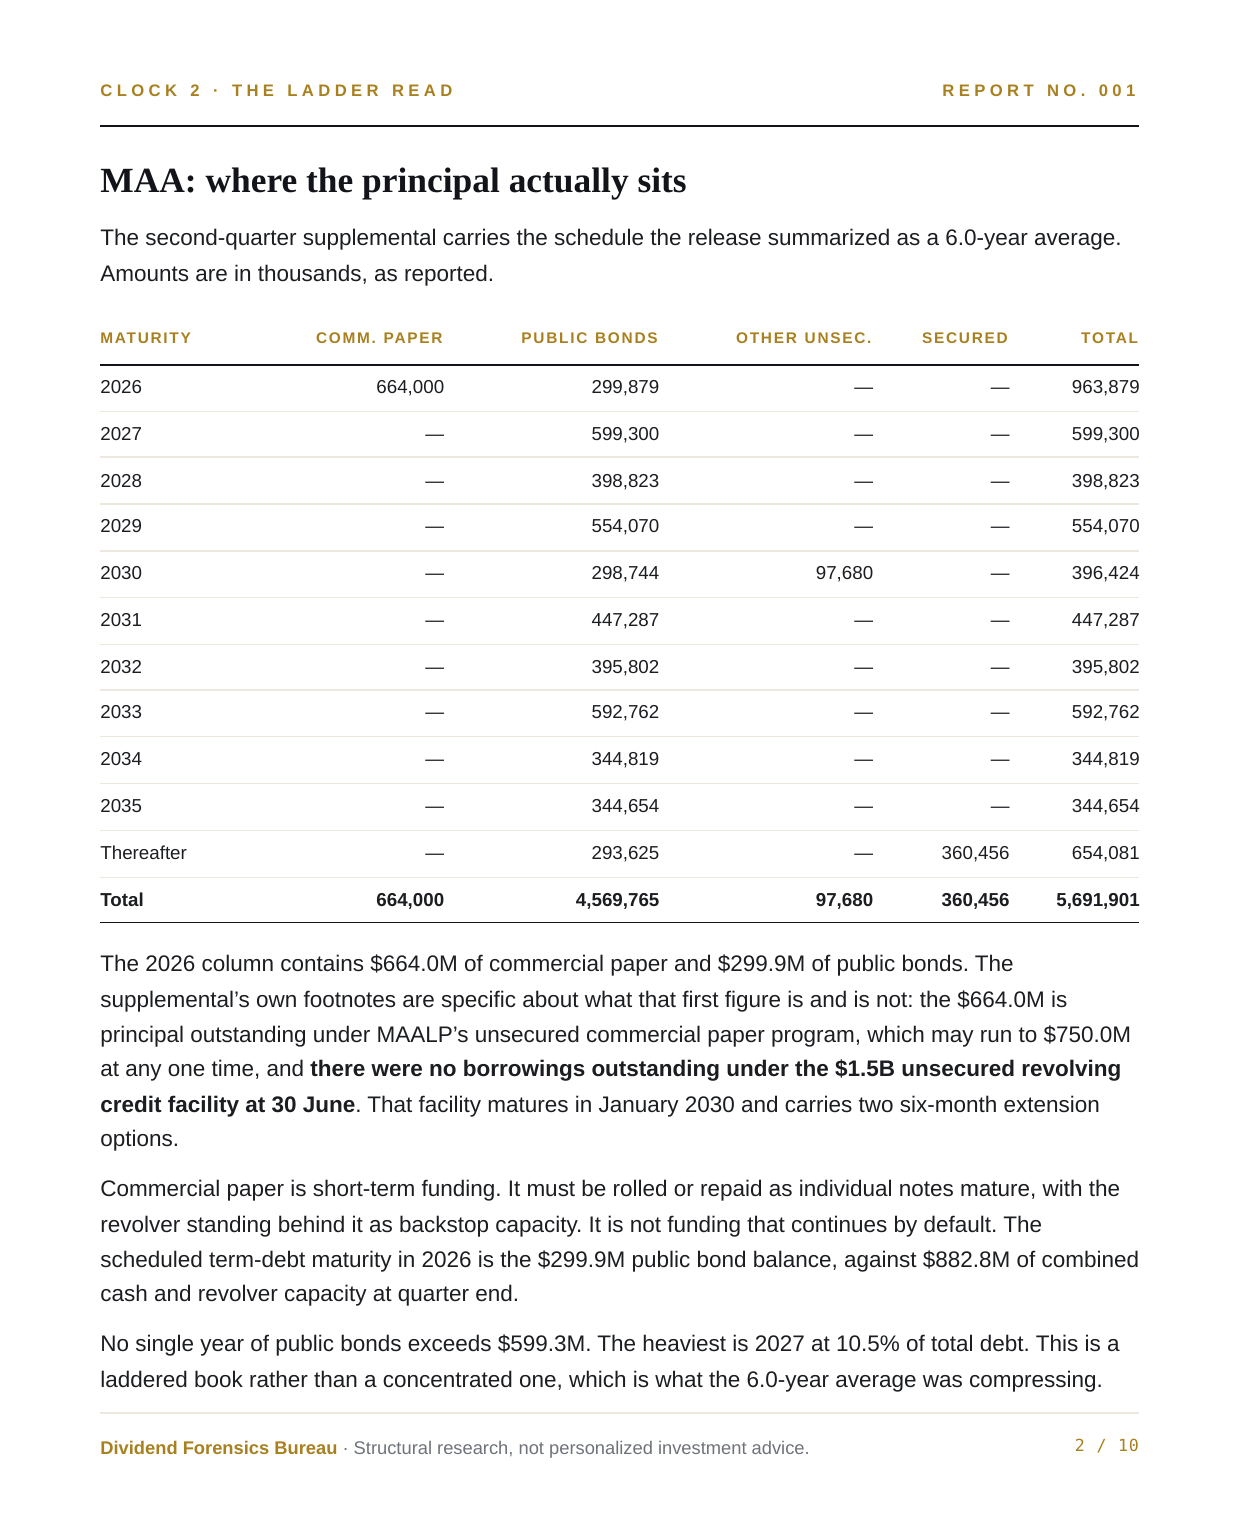
An issuer reported a 6.0-year weighted average. This is the schedule beneath it, rebuilt by year and by debt type, with commercial paper separated from term maturities and the total tied to $5,691,901 thousand as reported.
Source —- $664.0 million of commercial paper outstanding at quarter end, with the $1.5 billion revolver undrawn
- Four W. P. Carey term-loan and revolver borrowings identified by residual, then confirmed line by line against the debt overview
- Both issuers publish covenant distances in the quarterly supplemental rather than deferring them to the 10-Q
- Currency hedging on the euro-denominated notes
- Treatment after the December 2027 swap expiries
- Whether the drawn balance is hedged
Carried forward to the next disclosure. Not estimated, not inferred.
What this desk does not do
Stated plainly, because for a professional reader the constraints are as material as the coverage.
- No positions in securities covered
- No ratings or target prices
- No buy, sell or hold recommendations
- No transaction mandates
- Research conclusions are tied to issuer disclosures and stated calculation bases
Where a filing does not itemize a cause, no cause is assigned. Where two issuers define a measure differently, the comparison is declined rather than estimated. Unresolved items are listed as unresolved and carried to the next disclosure.
Structure, not sector
REITs and BDCs remain core areas of published work. The same filing-based method is used for selected operating companies and can be applied to growth-company financing. The examples below are not a promise of continuous coverage.
| Segment | Representative work |
|---|---|
| Net lease REITs | Realty Income, W. P. Carey, Agree Realty, NNN REIT, Essential Properties, Four Corners, Broadstone, Getty |
| Gaming, data center, towers | VICI, Gaming & Leisure, Digital Realty, Equinix, American Tower, Crown Castle |
| Residential, industrial, storage, healthcare | Mid-America, Prologis, STAG, Rexford, Americold, Public Storage, Extra Space, CubeSmart, Healthpeak, Omega, Welltower, Ventas |
| Business development companies | Ares Capital, Main Street, Blackstone Secured Lending, Goldman Sachs BDC, Blue Owl, non-traded BDC structures, PIK income |
| Mortgage REITs and credit | AGNC, Annaly, Blackstone Mortgage, Starwood Property |
| CLO and closed-end structures | Eagle Point, Oxford Lane, XAI Octagon, Cohen & Steers |
| Midstream, utilities, operating companies | Enterprise Products, Kinder Morgan, Duke, Southern, NextEra, UPS, FedEx, AT&T, Verizon, Brookfield Infrastructure |
For readers who use this work professionally
Questions about published research, sources, methodology, factual corrections, permissions, media and speaking are welcome. Organizational-use and data-delivery requests are inquiries only, not active product offers. DFB does not provide personalized investment advice or transaction instructions.
Report No. 001, a 25-page structural read in two volumes, is available at no charge on the home page.